A reorder point answers "am I low now?". It is a line, and you cross it or you don't.
Days of cover answers a more useful question: "when will I be?" A product with 40 units sounds comfortable until you know it sells 8 a day and your supplier takes a fortnight.
How the number is built
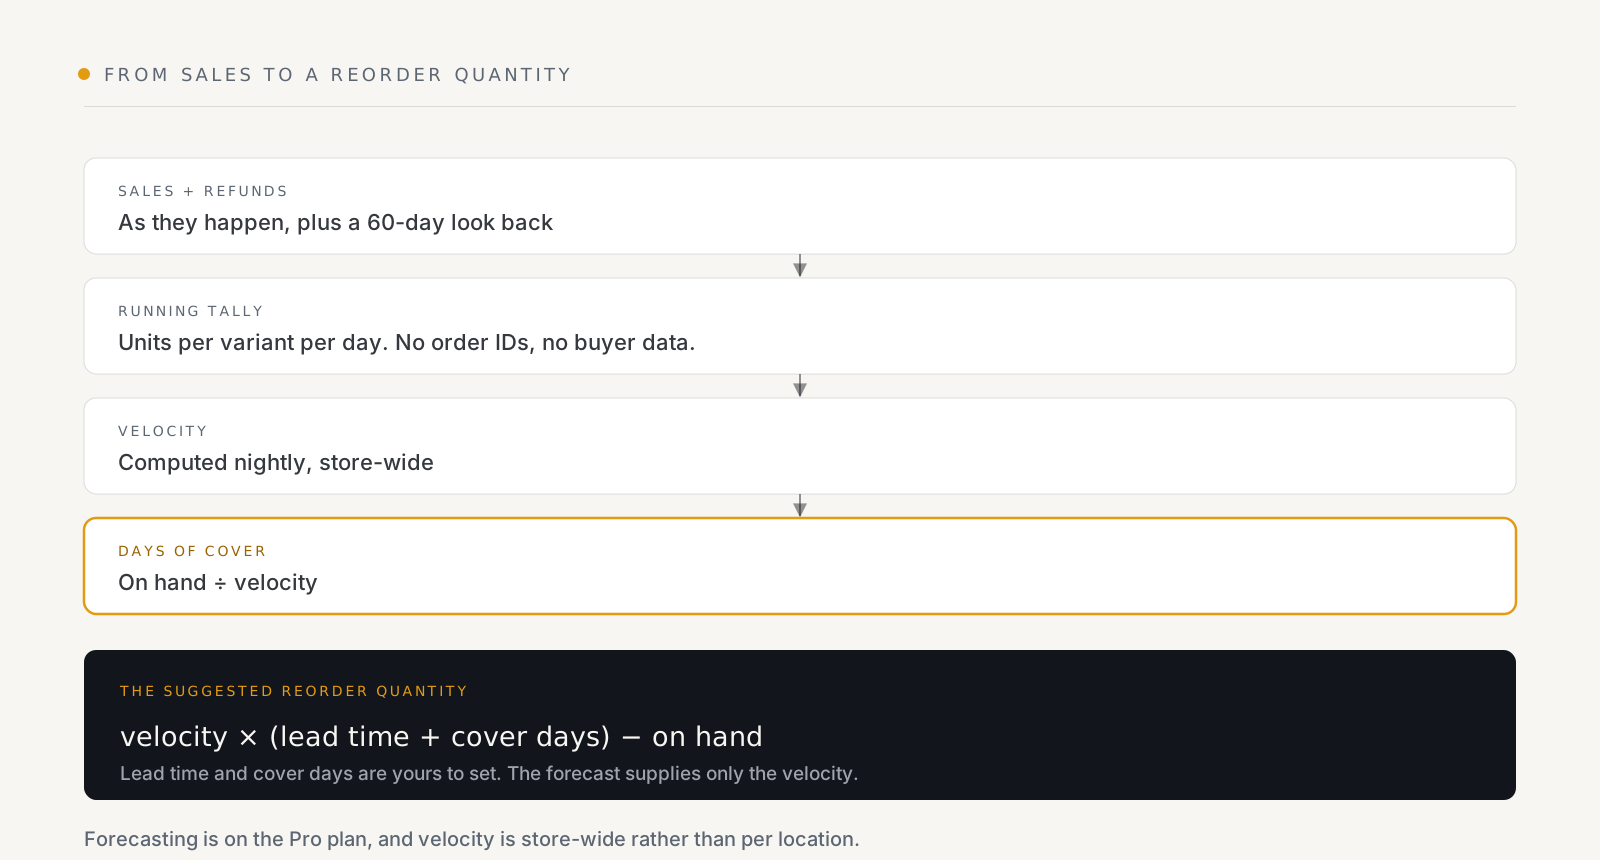
Velocity is units per variant per day, computed nightly. Days of cover is what you have on hand divided by that.
Both are store-wide, not per location. If you hold the same product in a warehouse and a shop, the forecast treats your stock as one pool. Per-location velocity is not something this does.
What it reads, and what it doesn't
This is the part worth being precise about, because "forecasting" and "we read your orders" often means something more invasive than people expect.
What it keeps is a running tally: units per variant per day. No order IDs. No buyer data. Quantities and dates, nothing else. It is built from sales and refunds as they happen, plus a single 60-day look back when you switch it on, so there is something to compute from on day one rather than in a fortnight.
Refunds are in there deliberately. A product that sells 20 and has 6 returned is not selling 20.
The suggested reorder quantity
When cover drops below your threshold, the alert carries a suggested quantity:
velocity × (lead time + cover days) − on hand
Read it as: enough to last until the delivery arrives, plus the buffer you asked for, minus what you already have.
Lead time and cover days are yours. The forecast supplies only the velocity. That division of labour is the right one, the app can measure how fast you sell, and it cannot know that your supplier is slow in August or that you would rather hold three weeks than one.
Set lead time honestly, including the slow weeks rather than the best case. A lead time that assumes everything goes right produces a reorder quantity that assumes the same.
Where it shows up
Days of cover appears as a column on the Inventory list, as a filter, in the CSV export, and as a dashboard tile. Which means you can work it two ways:
- Push, a "running out soon" alert when cover falls under N days, with the suggested quantity.
- Pull, sort the inventory list by cover and work down it. This is the one to do weekly. The alert catches individual items; the sorted list shows you the shape of the next month.
What it will get wrong
A velocity average is a claim that the recent past predicts the near future. That is usually true and specifically false at exactly the moments that cost you most:
- A launch. No history, so no velocity, so no useful cover number.
- A campaign or a feature. Demand steps up; the average lags behind it.
- Seasonal turns. The average is still describing last season.
- Very slow movers. A product selling 0.1 a day produces a cover number in the hundreds of days and a suggested quantity of roughly nothing. That is arithmetically right and operationally useless.
So treat the forecast as a queue to review, not an instruction to buy. It is very good at surfacing the twelve products you should think about this week out of two thousand you should not.
Using it alongside reorder points
They answer different questions and you want both:
| Reorder point | Days of cover | |
|---|---|---|
| Asks | Am I low now? | When will I be? |
| Based on | A number you set | Measured sales rate |
| Good for | Hard floors, safety stock | Planning the next order |
| Plan | Every plan | Pro |
A workable pattern: reorder points as the safety net that must not fail, days of cover as the weekly planning view. Keep the thresholds, see reorder points by SKU, collection or vendor, even after forecasting is on. A forecast can be wrong about a spike; a floor cannot.
See what StockNest does, forecasting is on the Pro plan; reorder points and alerts start on the free one.